Monthly VIIRS-like Nighttime Lights for Indonesia and Bolivia, 1992–2024
Exploratory research note
Monthly VIIRS-like Nighttime Lights for Indonesia and Bolivia, 1992–2024
A comparison of administrative-unit nighttime light trajectories, sensor-era transitions, and the methodological opportunities opened by monthly VIIRS-like reconstructions.
Abstract
This note presents a first visual comparison of monthly VIIRS-like nighttime light series for Indonesia and Bolivia from 1992 to 2024. The comparison is useful because it places two very different national systems under the same reconstructed monthly framework. Indonesia shows a visibly more unstable pattern during the observed VIIRS era, while Bolivia displays a smoother trajectory, although the transition between reconstructed and observed periods remains detectable. The central argument is not that the data are already flawless. Rather, monthly VIIRS-like nighttime lights open an unusually rich agenda for causal inference, spatial analysis, time-series diagnostics, and the study of periodic behavior, provided that researchers validate the reconstruction carefully.
Video overview
Video: https://youtu.be/5hYZxLolI68
1. Why monthly VIIRS-like nighttime lights matter
Many efforts have attempted to harmonize DMSP and VIIRS nighttime light products. One strategy is to reduce VIIRS information so that it resembles long-run DMSP-like series (Li et al., 2020; Tang et al., 2025). For example, Chiovelli et al. (2026) address DMSP saturation by extending the maximum digital number beyond the conventional cap, but the resulting product still works within a DMSP-centered framework. A second strategy moves in the opposite direction: it recalibrates or reconstructs older nighttime light observations in order to produce VIIRS-like series (Chen et al., 2021; Chen et al., 2024).
Most of these harmonization efforts operate at annual frequency. By contrast, Cheng et al. (2026) construct a temporally consistent global monthly VIIRS-like nighttime light dataset at 500 m resolution for 1992–2024, using convolutional neural networks and satellite-based controls to reconstruct how VIIRS-like observations may have behaved before the beginning of the VIIRS era. This monthly structure is the key novelty for empirical work: it allows researchers to study dynamics that annual data necessarily hide.
One important difference between DMSP and VIIRS is the timing of observation during the night. This matters because human behavior varies by hour: economic activity, electricity use, public lighting, religious events, commercial schedules, and social rhythms may all affect measured lights differently across the night. A country comparison therefore offers a useful first diagnostic. In this note, Indonesia and Bolivia are compared using administrative boundaries from Indonesia514 by Mendez et al. (2026a) and DS4Bolivia by Mendez et al. (2026b).
2. Indonesia and Bolivia as contrasting cases
The first figure shows that Indonesia displays a relatively unstable pattern during the VIIRS era. The administrative-unit trajectories become visibly noisier after 2012, and the national administrative-unit average shows repeated short-run disturbances. This does not automatically mean that the Indonesian series are unusable. It does mean that the observed VIIRS period should be treated as a period requiring additional diagnostics rather than as a clean continuation of the reconstructed pre-VIIRS period.
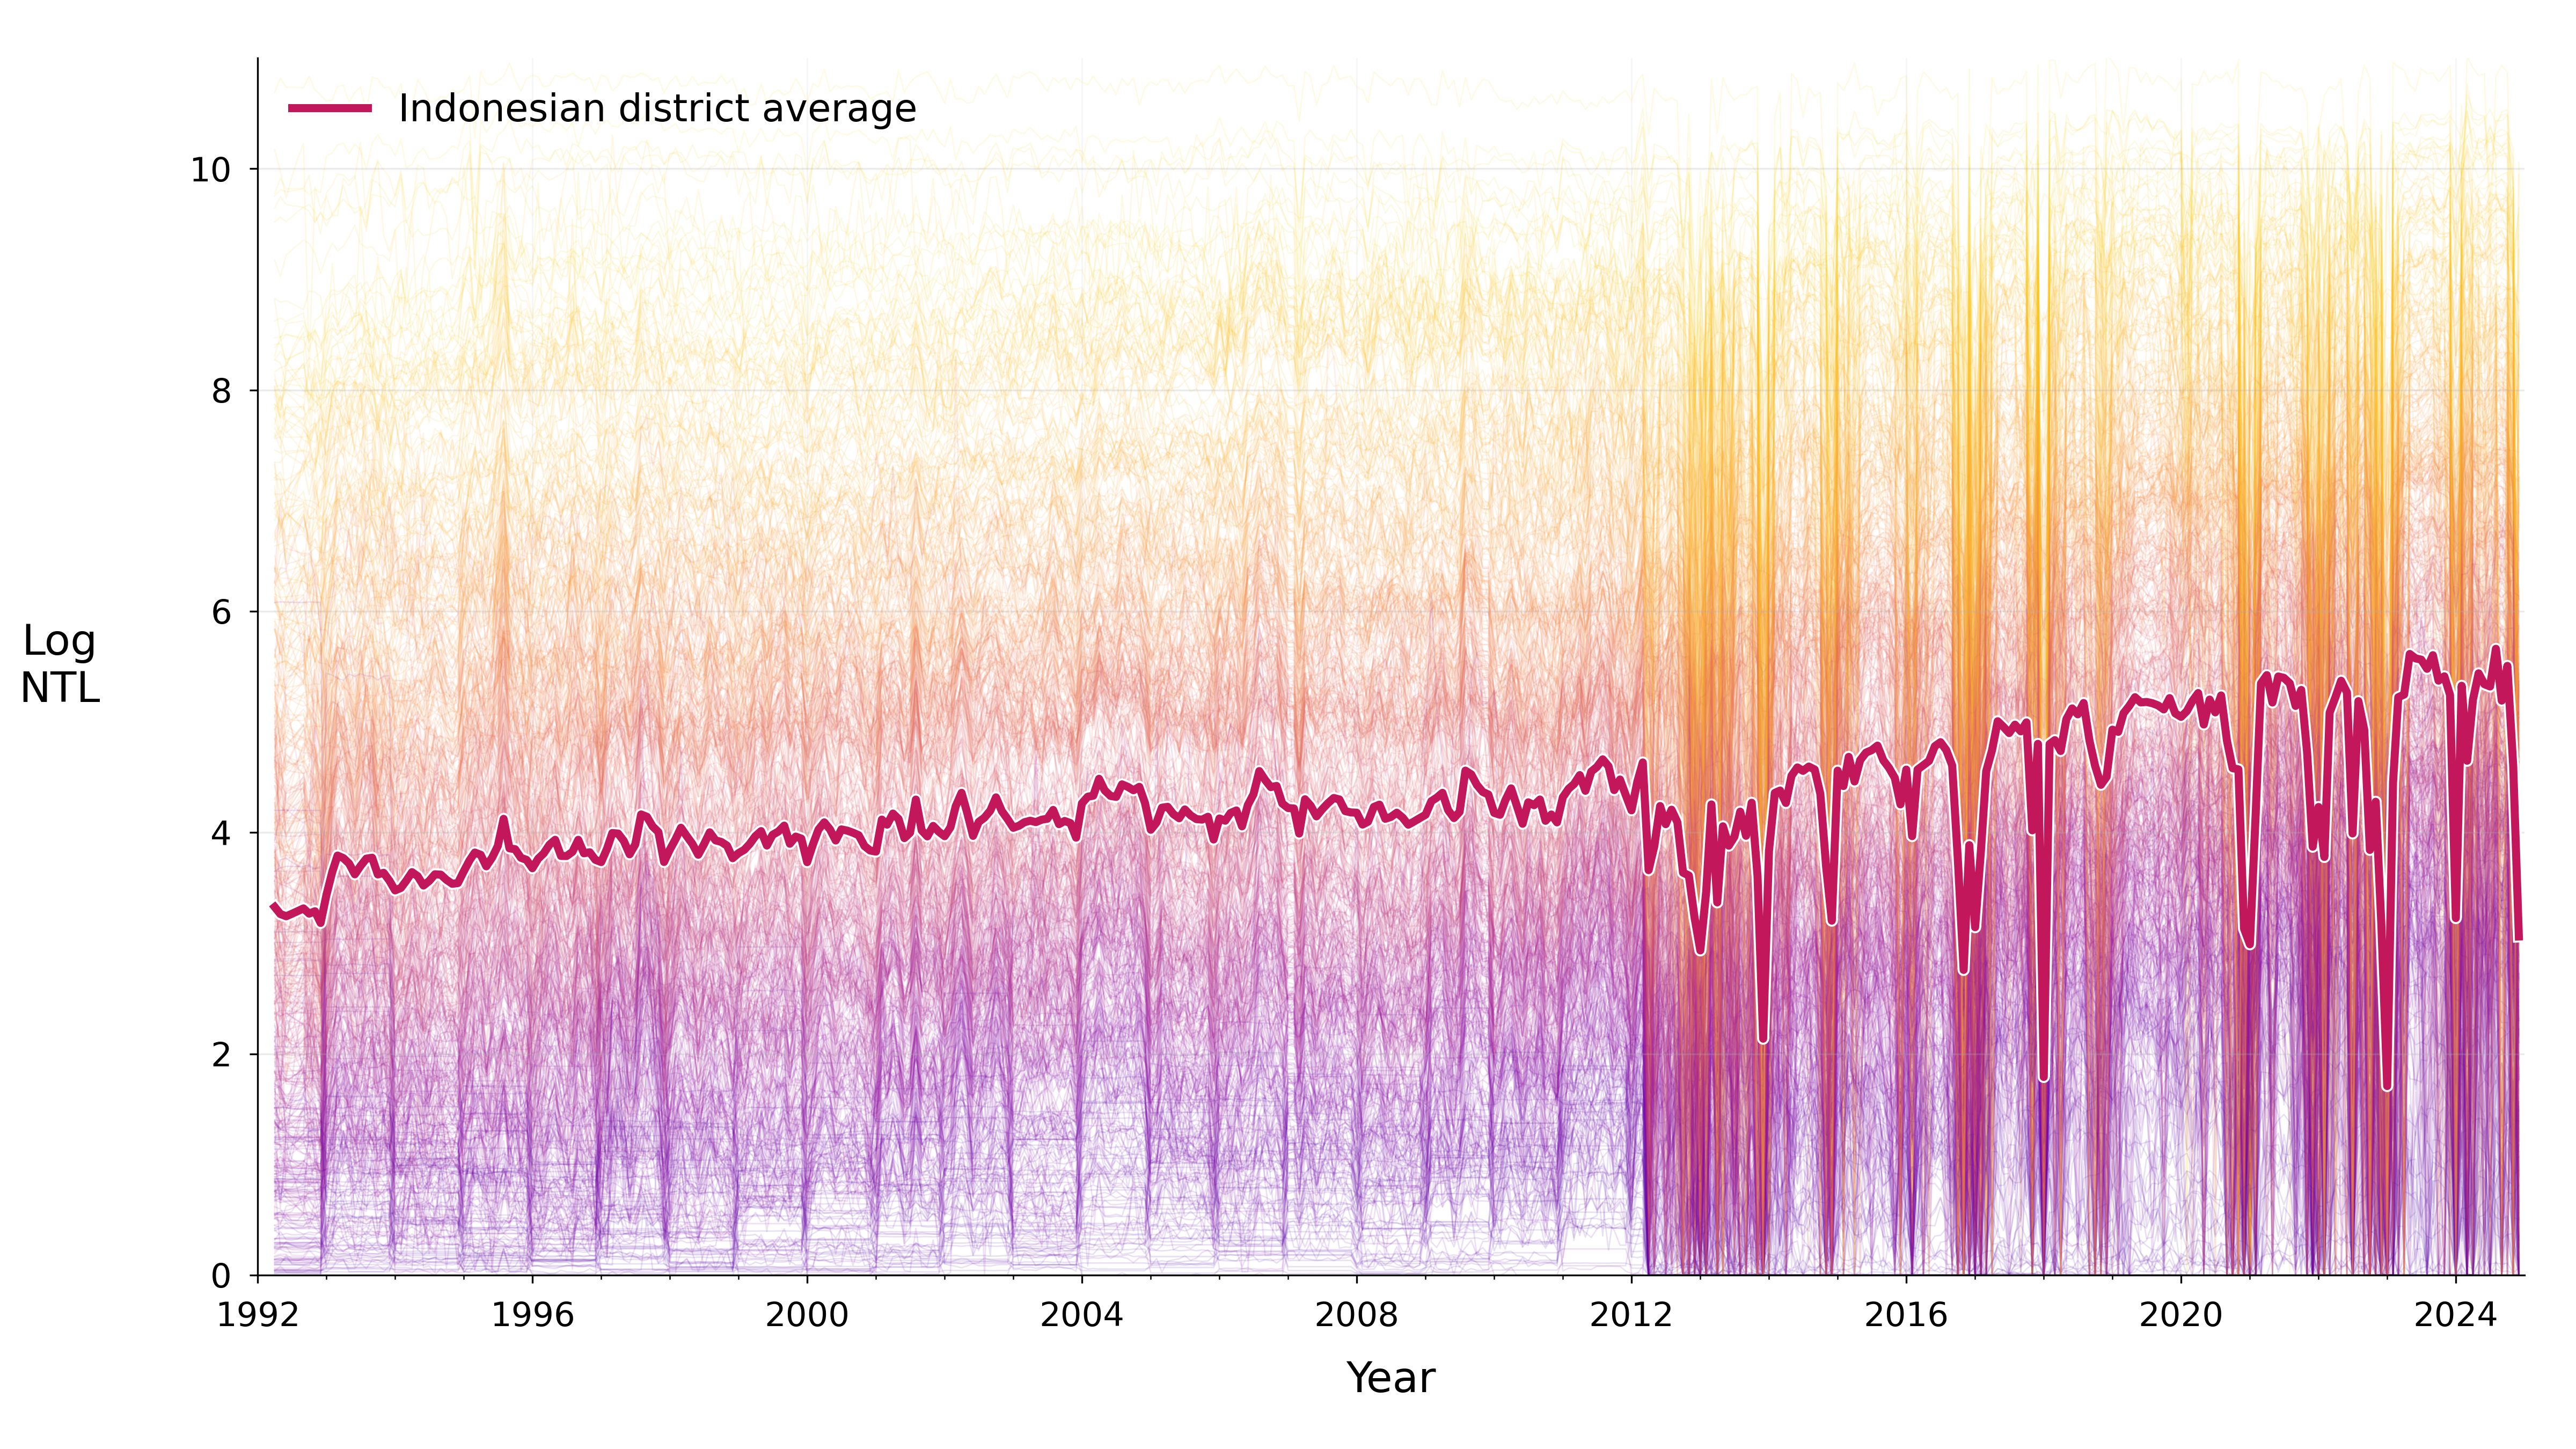
Source: Own preparation based on Cheng et al. (2026) and Mendez et al. (2026b).
The Bolivian series looks smoother. The municipal average rises gradually, and the post-2012 instability is much less visually pronounced. However, the comparison should not be overinterpreted. Even in Bolivia, the boundary between the reconstructed pre-VIIRS period and the observed VIIRS era remains detectable. The fact that the transition is less dramatic does not make it irrelevant.
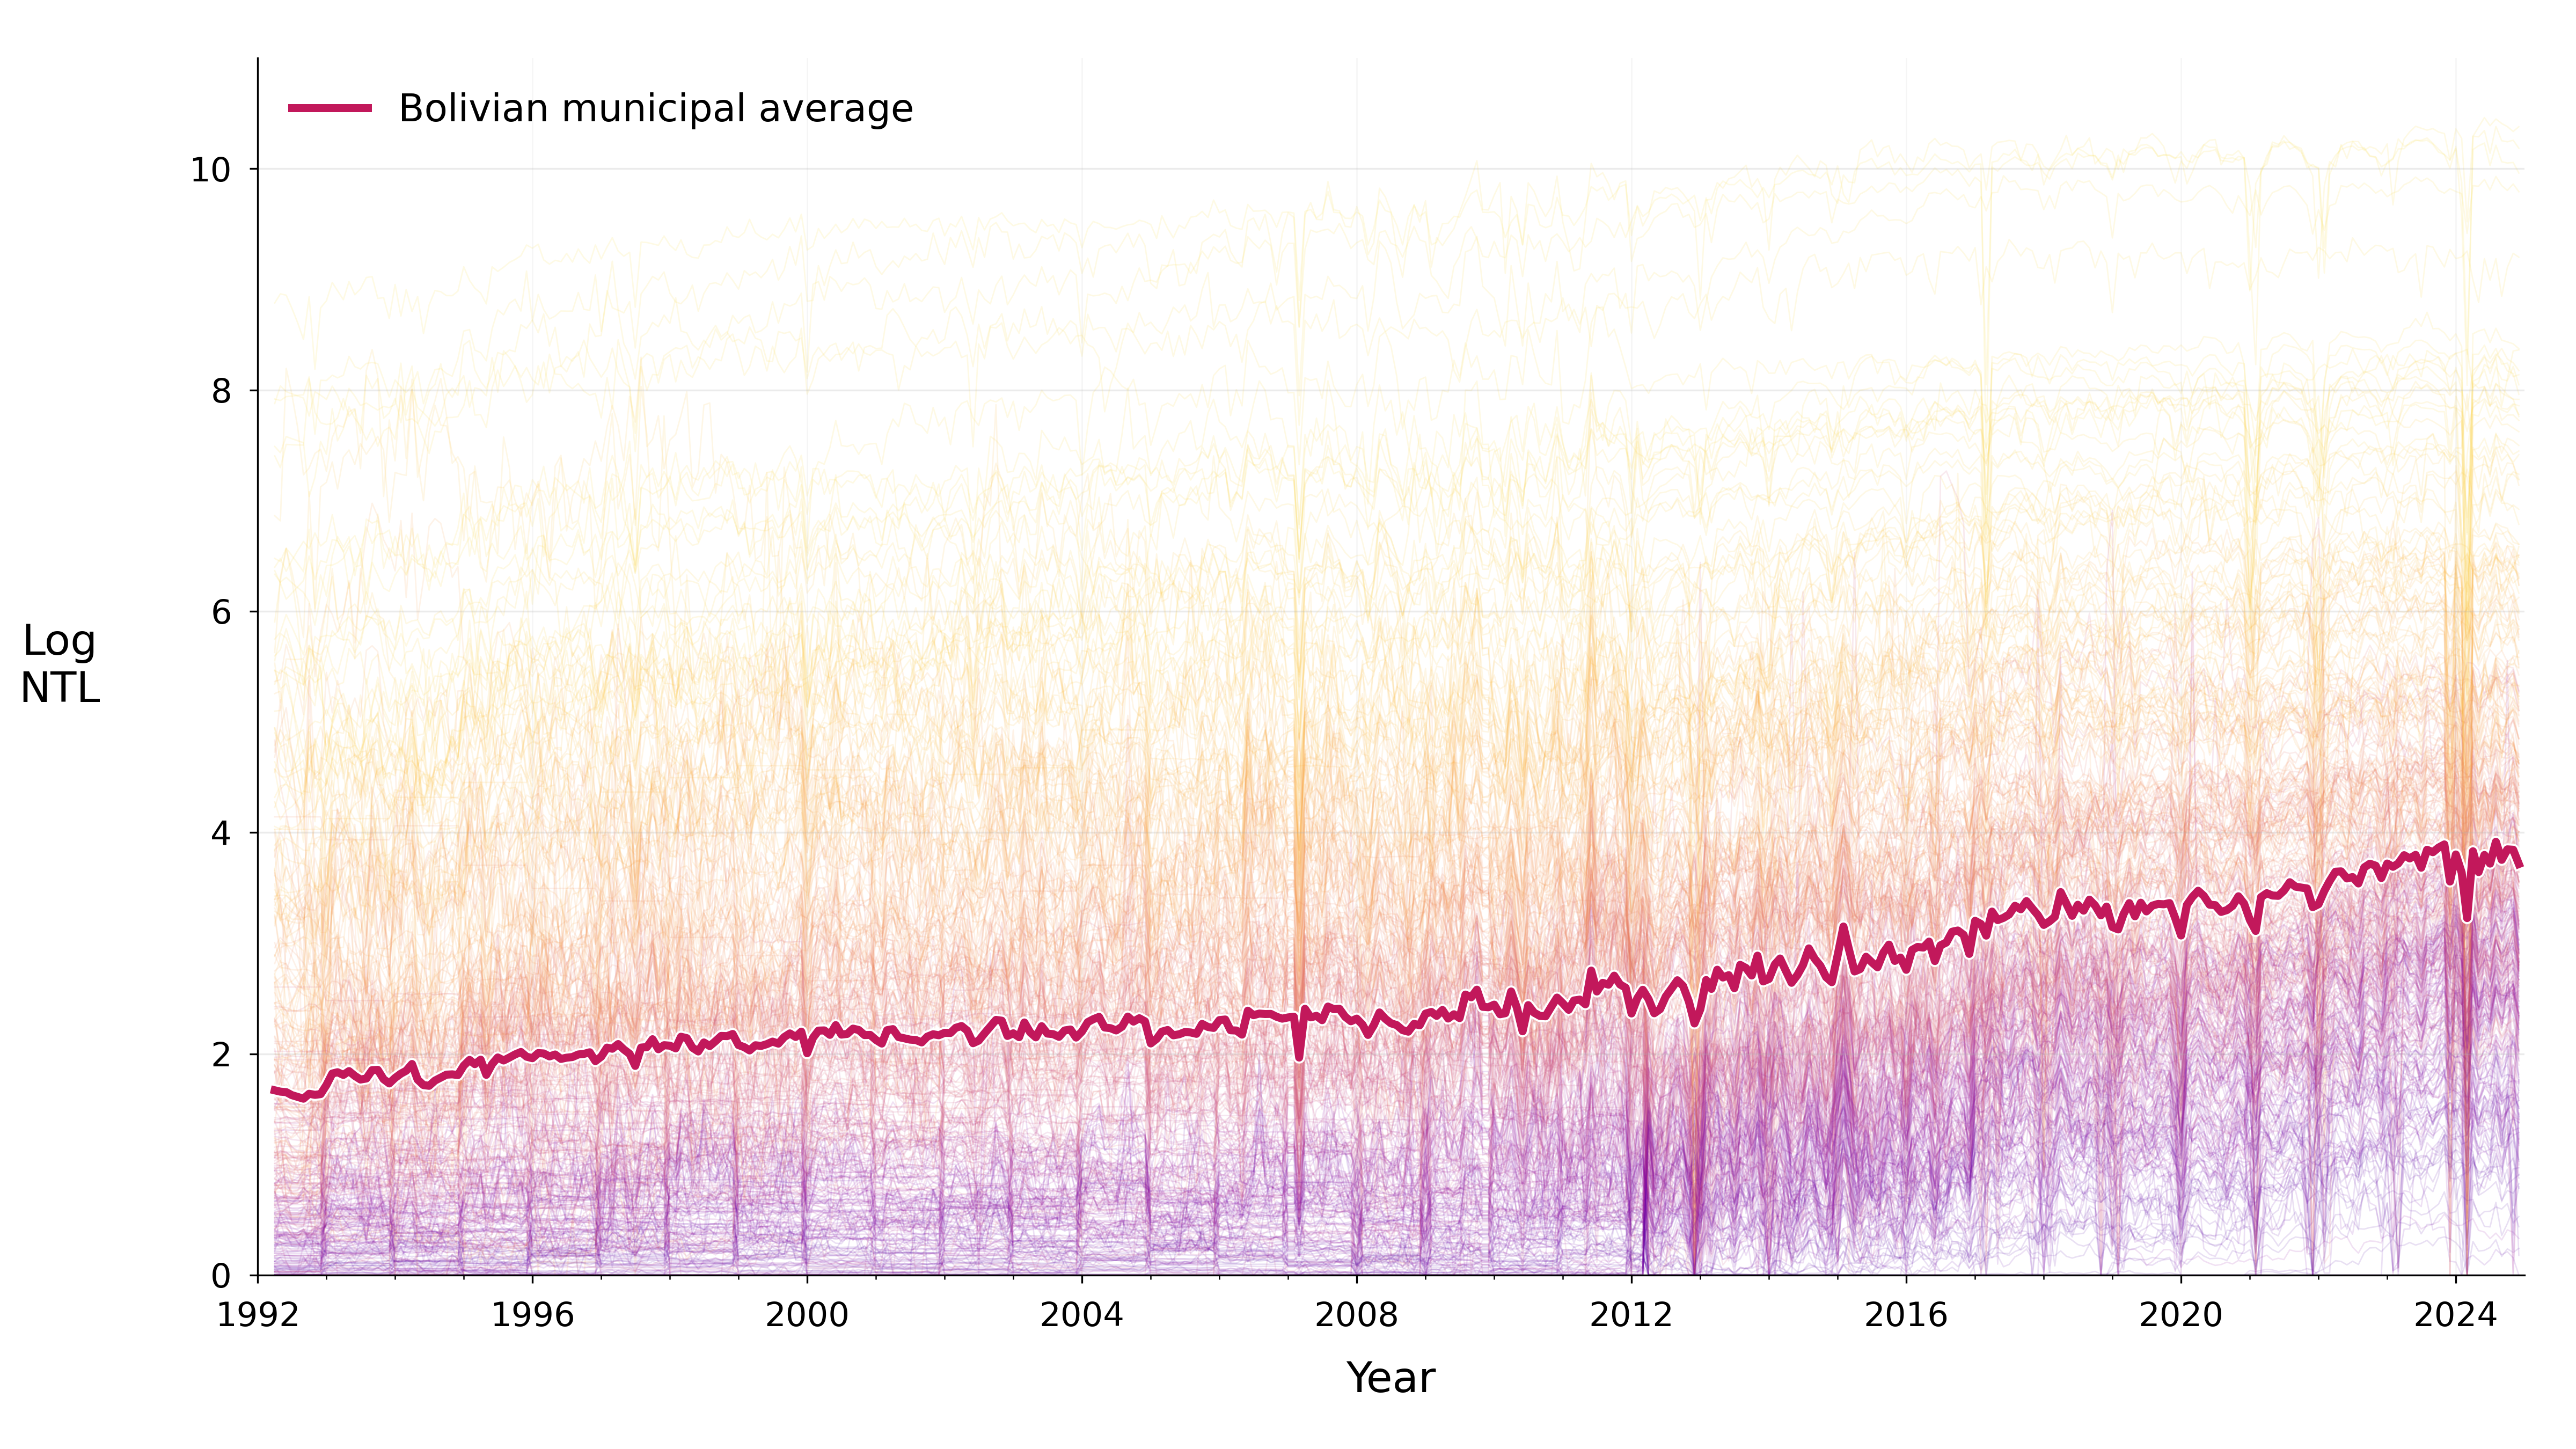
Source: Own preparation based on Cheng et al. (2026) and Mendez et al. (2026a).
3. Empirical questions raised by the comparison
Two questions follow from the contrast between the two countries. First, are the Indonesian fluctuations related to the Islamic lunar calendar in Muslim-majority districts? Religious events such as Ramadan and Eid move across the Gregorian calendar. Because these events may affect nighttime activity, commercial behavior, electricity consumption, and illumination patterns, monthly data make it possible to ask whether some of the observed variation follows lunar-calendar rhythms rather than conventional Gregorian seasonality.
Second, are the differences more pronounced in districts with higher levels of luminosity? Indonesian districts are expected, on average, to be more luminous than Bolivian municipalities. If instability is concentrated among brighter districts, the pattern may reflect how highly illuminated administrative units respond to the observed VIIRS era, to urban activity, or to differences in the distribution of lights within each unit.
Diagnostic implication
The figures should be read as an entry point for validation, not as final evidence. The next step is to separate country-level patterns from unit-level luminosity, religious-calendar periodicity, sensor-era transitions, and possible artifacts in the reconstruction.
4. Why raw DMSP remains limited
DMSP products have a well-known saturation problem. In bright urban cores, digital numbers are capped at 63, which makes the product less informative precisely where luminosity is most intense. A related issue in nighttime light products is blooming or overglow: light appears to spill over into neighboring pixels, affecting the spatial interpretation of illuminated areas. These limitations explain why VIIRS products are usually preferable to raw DMSP products, as long as the reconstruction strategy used to extend VIIRS-like information into the pre-2012 period is credible.
The promise of monthly VIIRS-like reconstructions is therefore substantial. They preserve more temporal and spatial detail than traditional annual DMSP-based products and allow researchers to analyze short-run dynamics. At the same time, the higher frequency also exposes problems that annual aggregation may conceal. Structural breaks, sensor-related artifacts, seasonal cycles, country-specific patterns, and transition effects must be studied transparently before these data are used in causal or long-term empirical designs.
5. A caution for causal inference near the 2012 transition
The transition between reconstructed pre-VIIRS observations and the observed VIIRS era is especially important for causal inference. Studies using shocks that occur very close to this transition should be interpreted cautiously. If a shock occurs near 2012, the estimated effect may partly capture how the dataset bridges the reconstructed and observed eras rather than the effect of the shock itself.
A prudent rule of thumb is to create a buffer around the transition. Causal studies focused on the reconstructed pre-VIIRS era should ideally analyze shocks that occur several years before the transition. Studies focused on the observed VIIRS era should ideally analyze shocks that occur several years after it. A three- to four-year buffer is a reasonable starting point, although the exact buffer should depend on the country, outcome, empirical design, and diagnostic evidence.
6. A methodological and empirical agenda
The possible applications are broad. These datasets are useful for synthetic control methods, long-term convergence analysis, spatial analysis, space-time analysis, and time-series research. Their complexity is substantial, but the opportunities opened by monthly nighttime light data are equally large.
The monthly frequency makes it possible to explore time-series patterns that are usually invisible in annual data. Stationarity, structural breaks, seasonal cycles, lunar-calendar cycles, and other periodic rhythms can be studied explicitly. Filters such as Hodrick-Prescott smoothing, Kalman smoothing, rolling windows, and kernel-based methods may help extract long-term trends from noisy monthly trajectories. Fourier analysis may also be useful for identifying recurring frequencies in nighttime light behavior.
This article should therefore be read as a first exploratory note. The figures suggest that the data are valuable, but also that researchers should proceed with caution. Monthly VIIRS-like nighttime light datasets appear promising for causal inference and long-term spatial analysis, yet strong filters and transformations must be applied with prudence and transparency. The main point is not that the data are already perfect. The main point is that they open a rich empirical agenda.
7. Data and replication
The administrative-unit panel datasets and replication notebooks are available for further exploration. The Parquet files provide compact formats for analysis, while the notebooks reproduce the figures and document the workflow that can be adapted to other countries or administrative maps.
Indonesia Monthly NTL
Bolivia Monthly NTL
Indonesia replication notebook
Bolivia replication notebook
General workflow notebook
Adapt the workflow to another country or administrative unit
References
- Chen, Z., Yu, B., Yang, C., Zhou, Y., Yao, S., Qian, X., Wang, C., Wu, B., & Wu, J. (2021). An extended time series (2000–2018) of global NPP-VIIRS-like nighttime light data from a cross-sensor calibration. Earth System Science Data, 13, 889–906. https://doi.org/10.5194/essd-13-889-2021
- Chen, X., Wang, Z., Zhang, F., Shen, G., & Chen, Q. (2024). A global annual simulated VIIRS nighttime light dataset from 1992 to 2023. Scientific Data, 11, 1380. https://doi.org/10.1038/s41597-024-04228-6
- Cheng, H., Geng, M., Li, X., Li, S., Zhao, M., Lin, C., Wang, J., Gong, P., & Zhou, Y. (2026). A temporally consistent global 500 m-resolution monthly VIIRS-like nighttime light dataset (1992–2024). Earth System Science Data, 18, 3449–3479. https://doi.org/10.5194/essd-18-3449-2026
- Chiovelli, G., Michalopoulos, S., Papaioannou, E., & Regan, T. (2026). Illuminating the Global South. The Economic Journal, ueaf134. https://doi.org/10.1093/ej/ueaf134
- Li, X., Zhou, Y., Zhao, M., & Zhao, X. (2020). A harmonized global nighttime light dataset 1992–2018. Scientific Data, 7, 168. https://doi.org/10.1038/s41597-020-0510-y
- Mendez, C., Gonzales, E., Leoni, P., Andersen, L., & Peralta, H. (2026a). DS4Bolivia: A Data Science Repository to Study GeoSpatial Development in Bolivia. GitHub repository. https://github.com/quarcs-lab/ds4bolivia
- Mendez, C., Abdulah, R., Arvianto, B., & Leiva, F. (2026b). Indonesia514: A Data Science Repository to Study Regional Development in Indonesia. GitHub repository. https://github.com/quarcs-lab/indonesia514
- Tang, H., Zhong, Y., Deng, J., Xia, H., & Wei, J. (2025). Global nighttime light dataset from 1992 to 2022 with focus on low-light areas. Scientific Data. https://doi.org/10.1038/s41597-025-05246-8
AI Use Disclosure
Artificial intelligence tools were used as part of the editorial and technical workflow for this essay. GPT-5.5 was used as a Socratic dialogue partner to refine ideas, improve language, and revise the structure of the text. Codex was used for agentic code-editing tasks, final HTML formatting, and consistency checks before publication.
All substantive arguments, interpretations, empirical decisions, and final editorial choices remain the responsibility of the author.